We are in the process of developing rapid and sensitive techniques for qualitative and quantitative analysis of complex proteome mixtures. As we develop these methods we have in mind the idea that we would like to look at complex mixtures in a single analysis. An issue that arises in such an approach is how to isolate components that have similar properties. One method that we are looking at is to couple capillary liquid chromatography with FT-Mass spectrometry; in this approach the high resolving power of the mass spectrometer is key to creating an enormous capacity for peaks. While we are extremely impressed with on-line FTMS approaches, issues for rapid analysis (especially MS/MS experiments on line, which are useful for generating sequence information) arise. Additionally, while an exact mass is perhaps the most distinct delineator of a compound; many compounds have identical chemical compositions and thus cannot be resolved based on m/z measurements alone. This is the case for all types of isomers (or systems that sample different conformations). To address this issue we employ mobility techniques. Until very recently the mobility experiment has been difficult to use in examining complex systems due to the pulsed nature of experiments and issues that arise upon injecting ions into the drift tube and getting them out the back. We have recently addressed many of the constraints and believe that these technologies are becoming highly competitive; additionally they offer a number of unique features in high-throughput analyses such as: (1) an additional dimension of separation in the gas phase (based on shape instead of mass); and (2) the possibility of a dispersive rather than a scanning approach for MS/MS experiments (see parallel fragmentation section of this website).
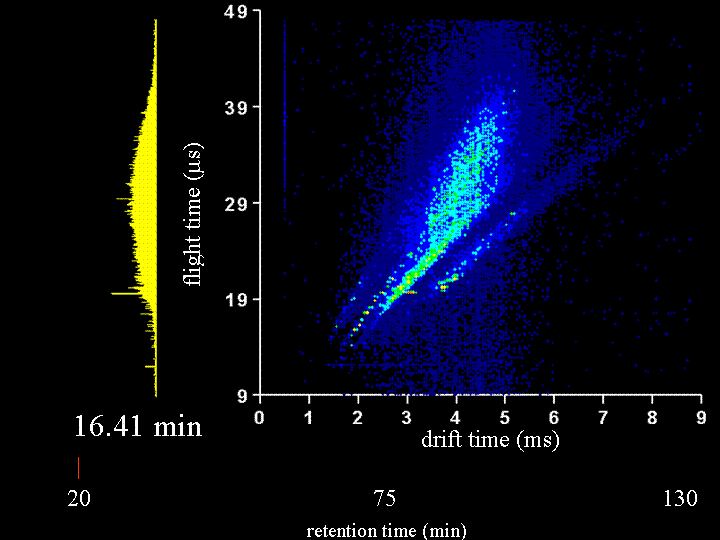
To demonstrate the multidimensional separations we show a movie below. This movie is a display of ~200 nested ion mobility time of flight data sets that are accumulated in 15 s increments as peptides leave the capillary column. The system that we have examined is the Drosophila fly proteome (an organism with a sequenced genome that comprises ~13,000 genes). This is an attractive system to us because there are many faculty in biology that work on issues related to the fly. We collaborate with Peter and Lucy Cherbas on our first questions that involve issues about how the fly proteome changes when stimulated with hormones that are involved in metamorphosis. Our approach has been to extract all soluble proteins, digest with trypsin (to create a mixture of tryptic peptides) and then label all peptides with an isotopically light or heavy version of the GIST label (developed in Fred Regneir's group at Purdue). We label peptides that come from what we refer to as a "standard fly state" with the light isotope label; we label peptides from the protein of the "hormone induced state" with a heavy isotope label. The present data shows a comparison of peptides from "standard" and "induced" states upon application of the hormone for 6 hours. The time dependence of the changes that are observed can be studied in detail by harvesting the induced states at different time intervals. Many different times have already been examined. In the data that are shown below, most of the peaks that can be seen appear to be doublets (thus there is an internal standard for most of the peptides).
It is worthwhile to say a few more words about the rate of data acquisition and the sample and instrumental parameters. We carry out these experiments using a home-built (prototype) instrument. Here, the instrument is a capilary LC–ESI source-ion trap-drift tube-quadrupole MS-octopole collision cell-reflectron mass spectrometer. We have operated the instrument with the quadrupole and octopole collision cells set to transmit all ions and the movie you will see is associated with only an LC–IMS–TOF separation. The sample was extracted, digested, labeled and mixed as described below. We injected about 100 micrograms of sample onto the column; however, we need to split the flow for our homebuilt source; thus, we only spray 20 micrograms. A detector at the back of the instrument is used to record the continuous ion signal that enters the instrument. On most days, we can focus a beam of ~106 ions/s through the instrument. Trapping efficiencies and duty cycles of the TOF are now such that we can record about 25,000 counts/s after the two-dimensional separation. Most of the loss occurs because we have not optimized the duty cycle of the tof (which typically is ~2 to 4%).
Clemmer Group (unpublished results).
In collaboration with Novotny and Cherbas Groups at Indiana University Bloomington and Regneir's group at Purdue.
